Gamma Exposure
Every day, the banks on the other side of the options market are forced to buy and sell the underlying — not because they have a view, but because their risk makes them. Gamma exposure is the map of that forced flow. It tells you when the market has brakes, and when it has none.
γOne number decides the whole character of the tape: are you above the flip, or below it?Somebody has to hedge
- STRIKE
- A fixed price level where option contracts exist. The options market is organised into these rungs — 4010, 4021, 4032 and so on. Every level in this guide sits at a strike.
- SPOT
- Simply where the market is trading right now. On every screen in this guide it's drawn as a horizontal line, so you can instantly see which levels are above price and which are below.
- EXPIRY
- The date a batch of option contracts dies. Options are grouped into expiries, and when one passes, every contract in it — and every effect it had on price — disappears.
- DEALER
- The professional firm on the other side of your option trade. A bank or market maker. They aren't betting on direction — they're managing risk, and that difference is what this whole guide rests on.
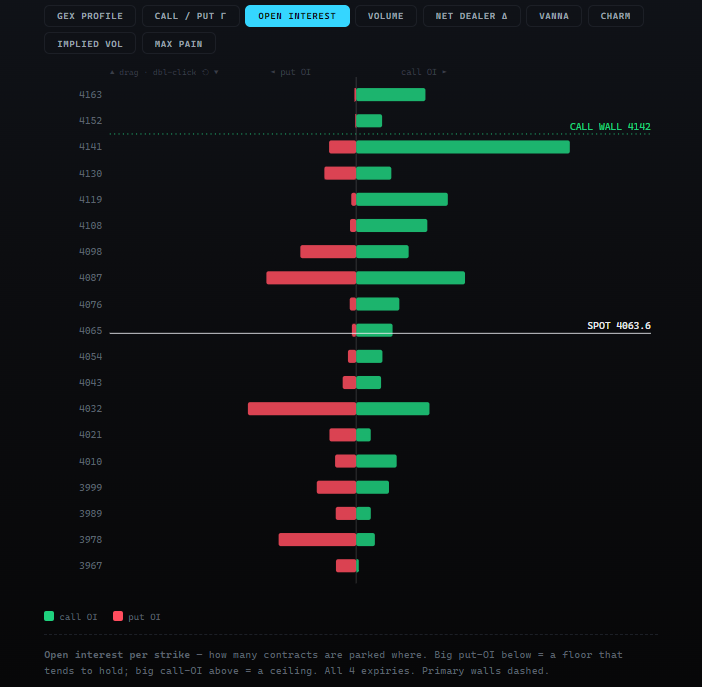
- OPEN INTEREST
- How many option contracts currently exist at a strike. Think of it as inventory parked at that price level.
When you buy an option, someone sold it to you. That someone is usually a dealer — a market maker whose business is providing the contract, not betting on direction. They don't want the directional risk they just took on, so they hedge it by trading the underlying.
Here's the part that matters: that hedge is not set-and-forget. As price moves, the amount of underlying they need shifts, so they must keep re-trading. They are forced buyers and sellers, every single day, in size, and entirely without a view on where price should go.
Gamma is the rate at which that hedging requirement changes. Gamma exposure (GEX) is that rate, multiplied out across every open contract in the market — the total size of the forced flow waiting at each price level.
No conspiracy required
Nobody sits in a room deciding to walk price to a level. Dealers hedge mechanically, because their risk limits require it. The price effects you're about to learn are a byproduct of that plumbing — not anyone's plan. That's exactly why it's reliable enough to trade around.
Brakes, or no brakes
Everything in this guide reduces to one question. Dealers are either long gamma or short gamma — and the answer completely inverts how the market behaves.
Dealers are net stabilisers. Every rally meets selling, every dip meets buying.
- Volatility compresses
- Ranges hold, edges get respected
- Breakouts fail and price snaps back
- Trading style: fade the extremes — sell the highs, buy the lows
Dealers are net accelerants. Every move gets amplified by their own hedging.
- Volatility expands
- Ranges break, levels give way
- Trends run further than they should
- Trading style: stop fading — go with the move
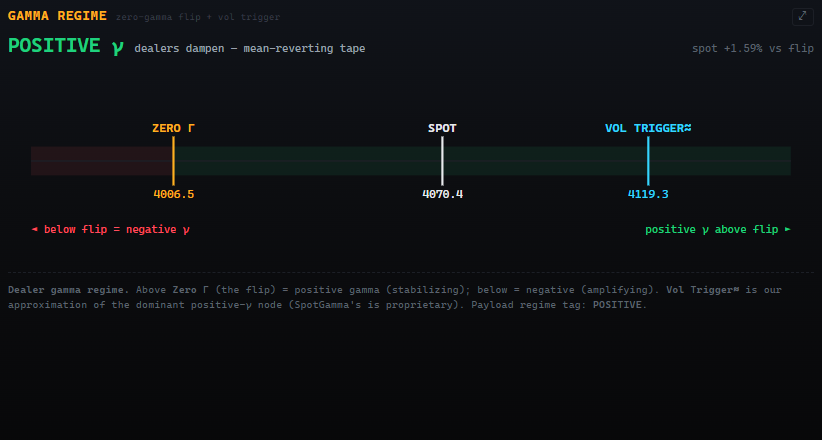
The GAMMA REGIME strip tells you which one you're in
You don't have to work this out yourself. The terminal prints the answer as a single line, with three markers on it:
| Marker | What it is | Why you care |
|---|---|---|
| ZERO Γ | The flip point — where total gamma crosses zero. | Above it you have brakes. Below it you don't. The single most important level on the screen. |
| SPOT | Where price is now. | Its position relative to ZERO Γ is the regime. Distance matters too — sitting 0.2% above the flip is not the same as 3% above. |
| VOL TRIGGER | Our approximation of the single biggest cluster of stabilising gamma. | Roughly the ceiling of the stabilised zone — where the pinning pressure is strongest. |
Distance is a dial, not a switch
The flip isn't a light switch that clicks at the exact price. Gamma fades gradually as you approach it. Sitting far above the flip means strong brakes; hovering just above it means weak brakes and a regime that could invert on a single bad candle. Watch the gap, not just the sign.
Green bars, red bars, and one big line
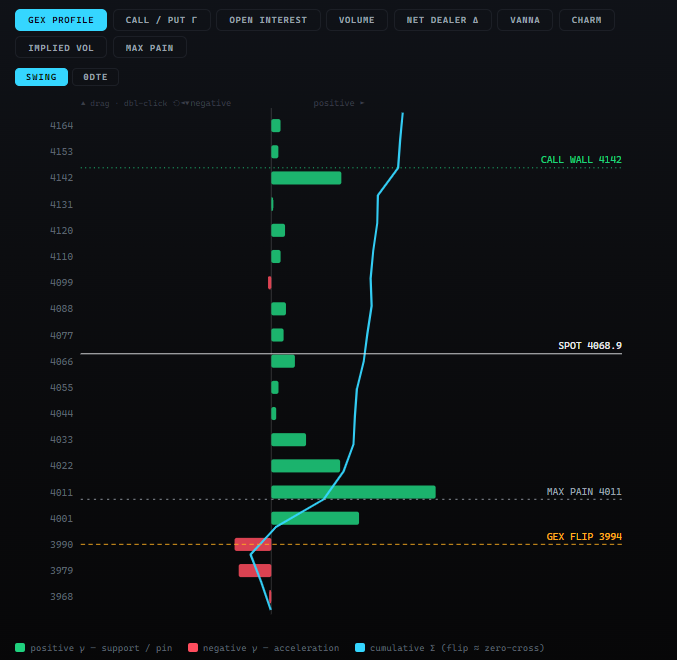
The GEX PROFILE tab breaks the total down strike by strike. Each bar is the net gamma sitting at that price. The colour is the sign — and the sign is everything.
Green bars — the brake
A green bar marks a strike where dealers are long gamma. Price approaching it from either side meets opposing flow. It slows down.
Red bars — no brakes
A red bar marks a strike where dealers are short gamma. Here their hedging joins the move instead of opposing it.
Why almost everyone gets this backwards
Red bars nearly always sit below spot, because customers are net buyers of puts and dealers end up short them. So in practice you only ever experience negative gamma as a downside accelerant, and it's natural to generalise from that. But when price does trade up through a negative-gamma pocket, it goes fast — that's a large part of what a melt-up or a short squeeze actually is, mechanically.
The four marker lines
| Line | What it means |
|---|---|
| GEX FLIP | The zero-cross of the blue cumulative curve. The regime boundary. Outranks every individual bar on the chart. |
| CALL WALL | The largest positive-gamma strike above spot. Acts as a hard ceiling and an upside magnet into expiry. A different animal from a normal green bar purely because of its size. |
| PUT WALL | The mirror below spot — the strike that tends to act as the floor. |
| MAX PAIN | Not a gamma level. It's an open-interest calculation — the strike where the most option value expires worthless. A weak drift target that strengthens as expiry approaches. Keep it mentally separate from everything else on this screen. |
The blue cumulative line
It's a running total of gamma across strikes. Only one thing on it really matters — where it crosses zero, because that's the flip. But its slope is a useful second read: a steep curve means gamma stacks up fast as price moves, so the regime is firmly held. A flat curve means the flip is fragile.
The net profile, taken apart
The GEX profile shows you the net at each strike — calls and puts already added together. The CALL / PUT Γ tab un-does that addition and shows you the two halves side by side.
This matters because a small net bar can hide two enormous opposing stacks. A strike showing near-zero net gamma might be genuinely empty — or it might be a battleground with huge call gamma and huge put gamma cancelling out. Those two situations behave completely differently when one side unwinds.
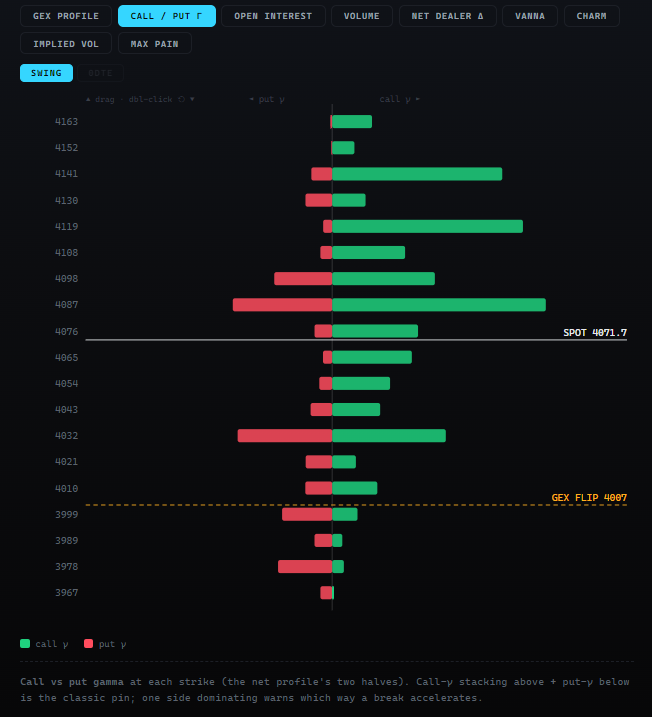
- Calls above, puts below — the textbook stable structure. Price is boxed in and pinning is likely.
- One side dominating — the box is lopsided. The thin side is where a break will run.
- Both sides huge at one strike — a battleground. High friction now, high energy release later.
- Both sides thin — genuine air. Price travels through this zone quickly and without much fuss.
Gamma has a shelf life
A gamma level is not a permanent feature of the market. It belongs to an expiry — and when that expiry passes, the level simply stops existing. This is the part most people miss entirely.
Gamma is enormous here — it concentrates violently as expiry approaches. These are the tightest, most powerful pins you'll see. And they evaporate completely at the close. Tomorrow they're gone.
The blend across expiries. Weaker per-strike, but far more persistent — these levels survive days and weeks. This is your structural map.
How to combine them
Use SWING to draw the map — the walls and the flip that define the week. Then switch to 0DTE to time entries against the levels the market is actually fighting over today. When a 0DTE level lands on a SWING level, that price is doubly important.
The strike × expiry heatmap
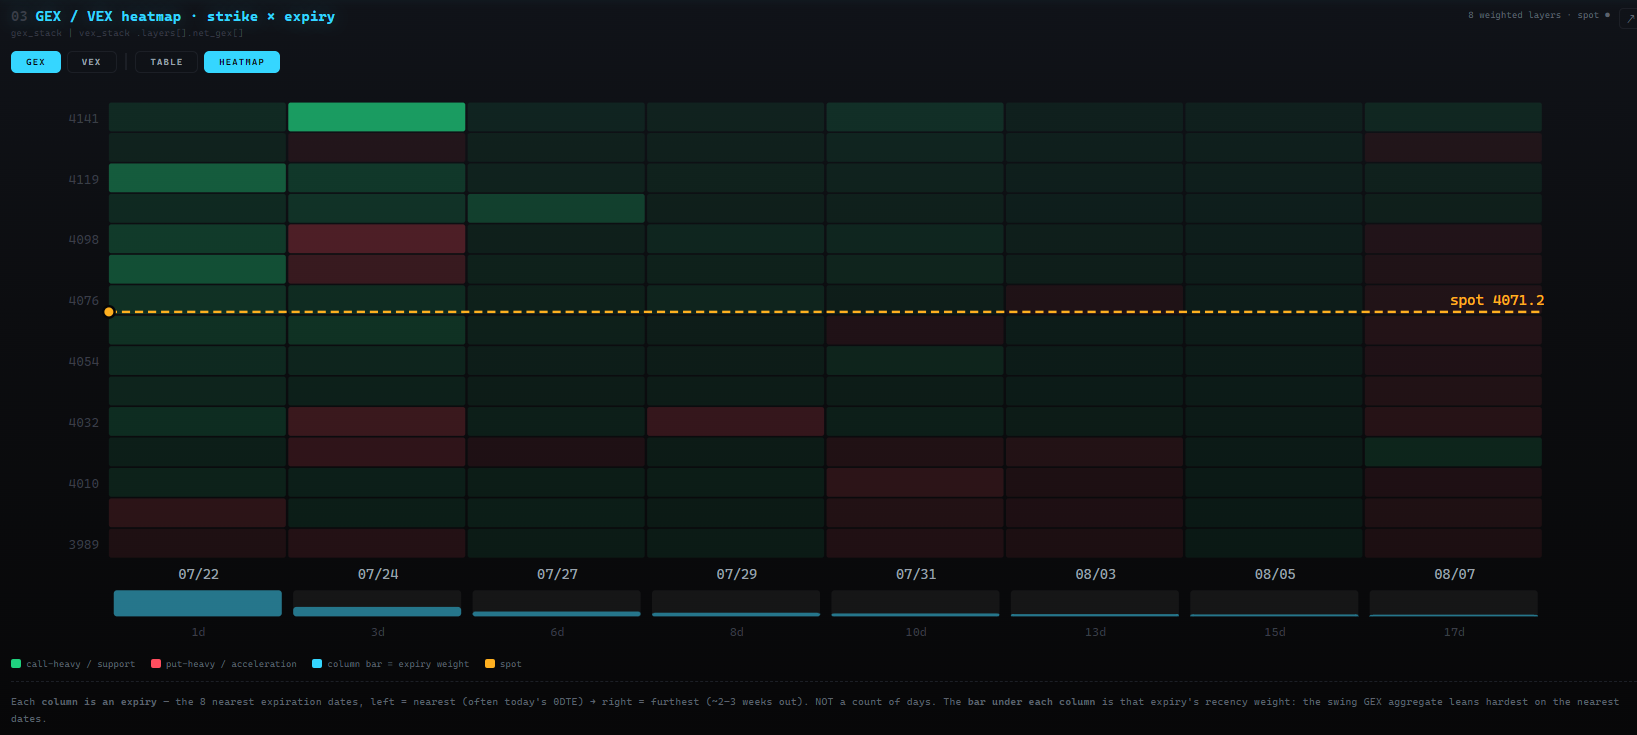
The profile collapses every expiry into one column. The GEX heatmap un-collapses it: strikes run up the side, each column is a separate expiry, and colour shows call-heavy (green, support) vs put-heavy (red, acceleration) at that intersection.
The columns are expiries, not days
This trips up everyone on first look. The columns are the 8 nearest expiration dates — leftmost is nearest (often today's 0DTE), rightmost is furthest out (~2–3 weeks). They are not evenly spaced in time and they are not a count of days. The bar underneath each column is that expiry's recency weight — the swing aggregate leans hardest on the nearest dates.
The two cousins of gamma
Gamma answers one question: how does the dealer's hedge change when price moves? But price isn't the only thing that changes. Two other forces move that hedge — and both get their own tab.
| Greek | Hedge changes when… | What it drives |
|---|---|---|
| GAMMA | Price moves | Pinning and acceleration. The main event. |
| VANNA | Implied volatility moves | Flows triggered by a vol spike or a vol crush — even if price hasn't moved at all. Marks the strikes where a change in fear forces the most re-hedging. |
| CHARM | Time passes | The classic drift into expiry. Hedges unwind on their own as the clock runs down — this is why Fridays have a character of their own. |
Why vanna looks upside-down compared to gamma
Vanna flips sign around spot and concentrates in the wings and in longer-dated expiries — the opposite of gamma, which peaks at 0DTE and near the money. So a vanna map that looks inverted next to your gamma map isn't broken; it's measuring a different force. Gamma is the near-term price story. Vanna is the volatility story, and it lives further out.
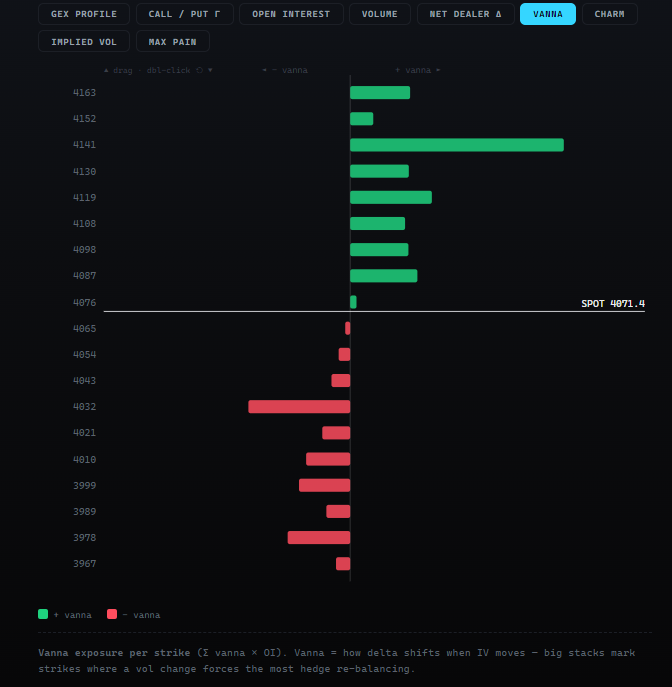
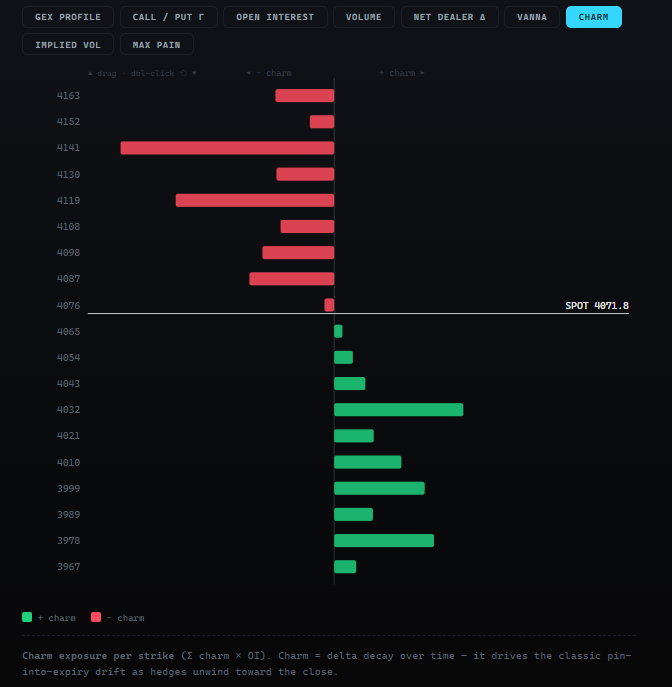
You don't need these to trade gamma. Treat them as the second layer: when gamma tells you the regime and vanna or charm agrees on the same strike, conviction goes up.
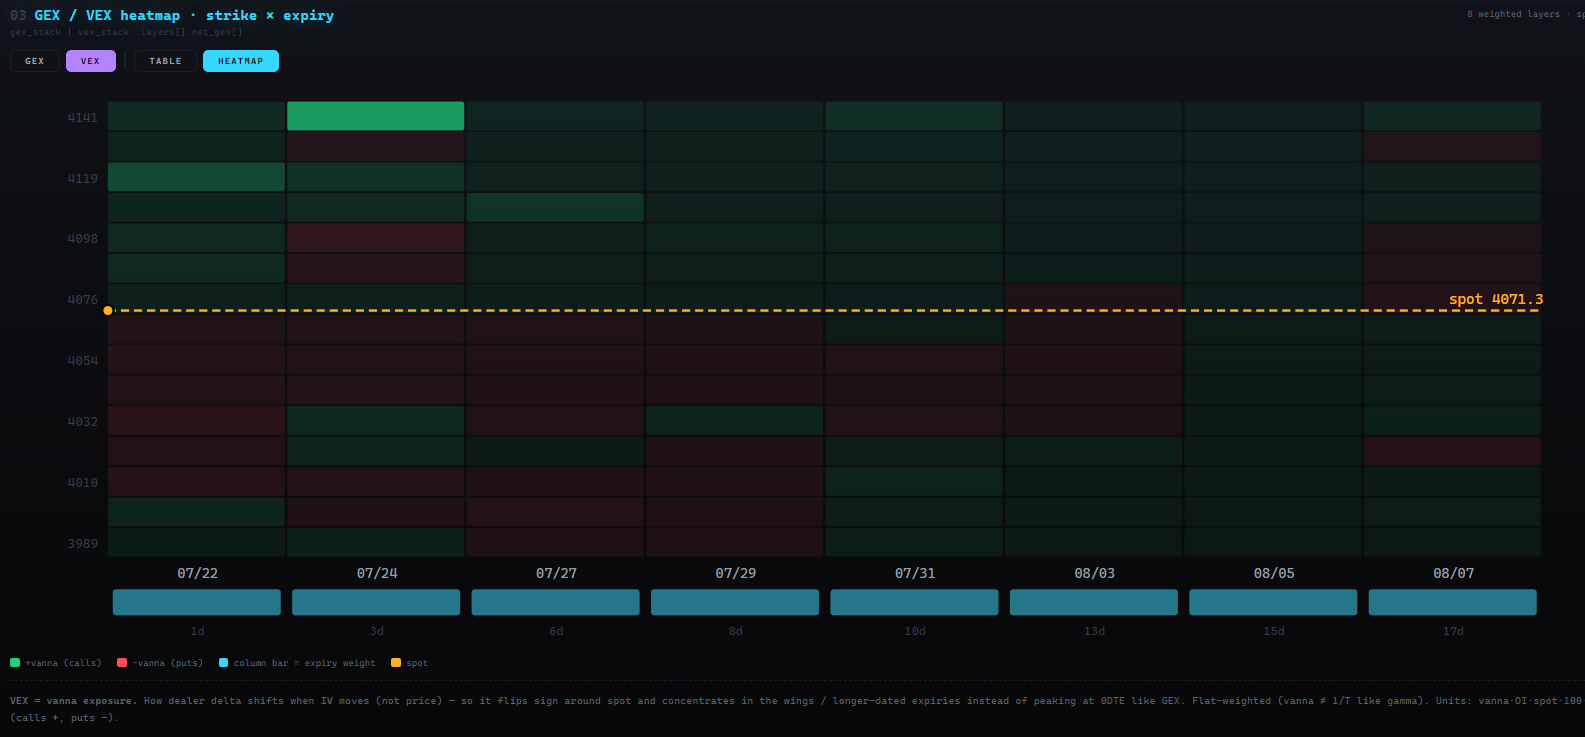
A four-step routine
Gamma doesn't give signals. It gives you the rules of the session — how the market is going to behave when it reaches a level. You still bring the trade.
- 1 · Check the regime first. Open GAMMA REGIME. Is spot above or below ZERO Γ, and by how much? This decides whether you're a fader or a follower today. Nothing else matters until you've answered it.
- 2 · Map the walls on SWING. Call wall above, put wall below. That's your box for the week. Note where the big green clusters sit — those are your magnets.
- 3 · Find the air. Look for the thin zones between clusters. Price crosses those fast. Thin gaps are where you give a trade room; heavy clusters are where you take profit.
- 4 · Time it on 0DTE. Switch expiry and find the level today's book is actually defending. When a 0DTE level lands on the same price as a SWING level — two independent things pointing at one number, which traders call confluence — that's your highest-conviction price.
The one-sentence version
Above the flip, sell the highs and buy the lows into green clusters and expect them to stall. Below the flip, stop doing that — respect the direction and let it run.
Confluence with the rest of the terminal
A gamma wall landing on a forecast cone band (Field Guide No. 01) or on an options heatmap wall (No. 02) is a high-conviction level — independent models agreeing. And the expected move band tells you whether reaching that wall today is even realistic: if the wall sits outside the ±1σ range, it's a target for later in the week, not a level for this session.
What gamma can't tell you
- Who's short what is an assumption. Open interest counts contracts, never sides — every contract is one long and one short. Turning that into dealer positioning requires a standard convention about which side dealers are on. It's a good assumption and it's the industry standard, but it is an assumption, and it's the single biggest source of error in all dealer-gamma analysis.
- Levels, not promises. A wall is where a reaction is likely, not guaranteed. Big enough real-world flow runs straight through any gamma level. Always wait for price to confirm.
- Gamma is not direction. It never tells you which way price will go — only how it will behave when it gets somewhere. Anyone selling gamma as a directional signal is selling you something else.
- Freshness matters. Over weekends and holidays the options data can go stale. The terminal flags staleness — don't lean on a frozen map.
- Max pain is a different animal. It appears on the gamma screen but it's computed from open interest, not gamma. Don't blend the two readings.
- Not every asset has a full book. Coverage and expiry depth vary by instrument. A thin chain produces a thin, less reliable gamma map.